Introduction
The focus of this paper is on how an ontology-based GIS system can be populated with class instances and further maintained by domain experts with no support from ontological engineers. This is an old goal of knowledge engineering. We present our approach in the context of a specific Semantic GIS system called EventMap (Nakhimovsky 2010), but the techniques we propose should be of general interest. At the core of our approach are two simple observations. First, instances of a given class can be described by a table in which each row corresponds to an instance and each column to a property. Such tables can be created in a context that allows data validation for data properties and, for object properties, provides access to already created instances of the object class. If the tables are kept in the cloud (e.g., Google spreadsheets) then we have a ready-made environment for joint distributed authoring, essential for creating community-based resources. The second observation is that map layers can be described by KML documents which can be created using a variety of tools ranging from ArcGIS to the free KML editor built into Google Maps / My Places. This is a flexible arrangement that makes simple things easy and difficult things possible.
Specifically, in this paper we present two mechanisms for data entry: via a blog with links to KML data, in which each blog entry corresponds to an event; and via a Web application that reads in the relevant subset of an ontology (expressed as metadata tables) and provides a form that validates new class instances against that ontology.
The EventMap Framework
An EventMap is a sequence of annotated maps produced by a GIS system and controlled by a Timeline: each map corresponds to a time interval, and together a map and a time interval represent an Event. The Timeline makes it possible to navigate event sequences and observe changing event patterns over time; the patterns depend on the query posed to the GIS system. Every event is linked to an annotation that can contain arbitrary web content, including images, multimedia, and output from Web applications. Internally, the content is represented by RDF graphs; specific event sequences, their maps, and their annotations are produced by a SPARQL query (DuCharme 2011).
Instead of thinking of an EventMap as a sequence of maps each corresponding to a time interval and annotated by a web page, one can think of it as a sequence of pages each annotated by a map. A good example of this kind of book is McEvedy (2003). EventMap is a framework for creating such books online.

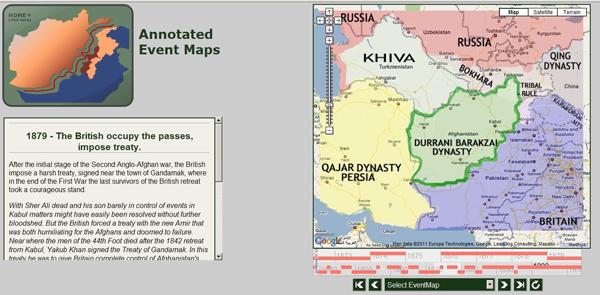
Figure 1: An Event Representation
Figure 1 shows a Google map overlaid with a scanned and edited map of Afghanistan’s borders in 1879. It corresponds to the historical event of the treaty of Gandamak, formalizing the British occupation of the mountain passes into Afghanistan in response to rapid Russian advance into Central Asia. Pink strips on the Timeline correspond to events and link to event descriptions. The controls help navigate the events.
The Architecture of the Framework
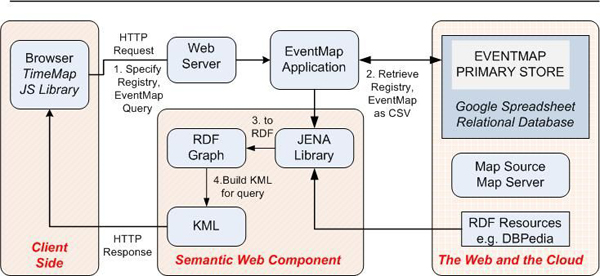
The overall structure of the EventMap framework is shown in Figure 2. EventMap data are kept in a Primary Store, with links to other materials. The Store can be in any data structure that can be serialized in the Comma-Separated Values (CSV) format; this includes spreadsheet and relational database. The Store can be located in the cloud, which creates a framework for collaborative authoring that does not require advanced computer skills or server maintenance. We have been using Google spreadsheets, partly because Google provides HTML forms for editing them, and we can write code to validate user input and pre-populate the forms with data that the author must verify but rarely needs to type.

Figure 2: EventMap Architecture
In more detail, the Primary Store contains a number of Repositories, each a container of material on a specific topic, such as the history of Afghanistan borders, or the history of Arctic research during the Second International Polar Year. A repository contains the following kinds of materials:
- data tables, each corresponding to a class of objects or events
- metadata tables, one for each data table; they describe the table’s schema.
- an OWL ontology that defines the classes of objects and events in data tables, and provides axioms about them.
When a repository is loaded, all the data tables are linearized as CSV (Comma-Separated Values) and passed to a Java servlet, together with the ontology. The servlet invokes the Jena library to build one big RDF graph out of the tables and the ontology. Individual EventMaps (e.g., the story of a particular Arctic expedition, or the changing patterns of networks of international cooperation) are produced by SPARQL queries from the repository graph, and sent to the timemap library (Timemap 2012) that controls the display of the map and the timeline.
Creating a Repository
To create a new repository one needs to
- add to the ontology as needed;
- populate data tables, using an HTML form with ontology-based validation;
- create map layers, as KML files;
- create annotations, which are Web content.
Only the first of these tasks requires a practicing ontologist; the rest is done by domain experts. The ontology and the data tables are aligned, in the sense that if a class has a certain property then the data table has a column whose header is the name of that property. In addition, if the class name has a Wikipedia entry with an infobox, we use the same property names as the infobox, gaining additional alignment with DBPedia.
Eventmap Authoring
We can usefully distinguish two levels of authoring: working with events within an existing EventMap, and creating a new EventMap. To add an event, one first needs to create a KML file with a placemark or several Placemarks for the event, and an HTML file with the event’s description. This is the creative part; the rest is just filling out a form with time data and links to resources. To edit an existing event the user works with the same tools, but requires a different level of access to the repository. Creating a new EventMap involves creating a metadata table for it, which may be too complex for some domain experts, although most of them will probably be able to copy an existing metadata table and modify it for their needs.
To recapitulate, we are trying to provide a range of options for data entry by domain experts. At one end are users who have access to ArcGIS, Adobe Dreamweaver, and competent designers who transform their knowledge and data into compelling maps and Web pages. At the opposite end are users who are content with simple vector-graphics layers, and a simple arrangement of text and images, to tell a story or to visualize a process. For this latter case, we provide a Blogger-based interface that makes it possible to create an EventMap as a sequence of blog entries. The only constraint is that each entry needs to specify the start and end times of the event, and a link to the KML file that describes the placemark(s).
Comparison to similar efforts
As a story-telling and history-writing framework, EventMap resembles two other efforts: (Visual Eyes 2012) (formerly History Browser) and (Pleiades 2012). Compared to Visual Eyes, EventMap requires less of a learning curve, and is more cleanly based on standard technologies. Compared to Pleiades, EventMap is more flexible because based on dates rather than a closed list of named ‘epochs.’
EventMaps should also be considered in the context of the larger Historical GIS effort (Gregory & Ell 2007). While EventMaps cannot match the scope of large national databases of geospacial data, Google spreadsheets’ storage capacity and computational power provide an adequate platform for many projects in which GIS databases are used. EventMaps can use a database as well, but databases are expensive to create, maintain, and make globally accessible, while Google servers offer an unparalleled global network for free.
Acknowledgements
This work was supported by the National Science Foundation [7017695 to A.N.].
References
DuCharme, B. (2011). Learning SPARQL. Sebastopol, CA: O’Reilly.
Gregory, I., and P. S. Ell (2007). Historical GIS: Technologies, Methodologies and Scholarship. Cambridge: Cambridge UP.
McEvedy, C. (2003). The New Penguin Atlas of Ancient History: Revised Edition. London: Penguin.
Nakhimovsky, A. (2010). Timelines, Google Maps, and Visualization of History. Paper presented at the Biannual European Social Science History Conference (ESSHC) Ghent, April 13-16.
Pleiades (2012). http://pleiades.stoa.org/. Accessed March 1, 2012.
Timemap (2012). http://code.google.com/p/timemap/ Accessed February 28, 2012.
Visual Eyes (2012). http://www.viseyes.org/. Accessed March 1, 2012.

